文章目录
前言一、python 代码实现`statsmodels` 中的 `predict` 和 `forecast``predict``forecast` 实际运用滚动预测 向后预测的代码 二、Matlab 代码实现ADF检验确定 p、q 的值`aicbic(logL, numParam, n)` 函数 向后预测的代码 三、python 和 Matlab 的完整代码pythonMatlab
前言
【Matlab】时间序列模型(ARIMA)
【python】时间序列模型(ARIMA)
之前的两篇笔记用 Matlab 和 python 实现了对股票的预测,但是实现效果并不理想,近两天又翻阅了其他的一些资料,对预测的代码进行了改进。
一、python 代码实现
python 的 statsmodels 库中预测函数大致分为两个,一个是 predict 函数,另一个是 forecast 函数。两个函数的使用上有所不同。
statsmodels 中的 predict 和 forecast
predict
用途: predict 函数通常用于生成模型拟合期间的数据预测。它可以用于生成拟合数据的未来预测,也可以用于生成训练数据期间的拟合值。用法: predict(start, end),其中 start 和 end 参数定义了预测的时间范围。 forecast
用途: forecast 函数专门用于生成未来的预测值。它通常在模型已经拟合好的情况下使用,用于生成未来多个时间点的预测。用法: forecast(steps),其中 steps 参数定义了要预测的未来时间点数量。 选择使用哪个函数取决于你的具体需求。如果你需要预测未来的时间点数据,使用 forecast 更合适;如果你需要对现有数据或拟合期间的数据进行预测,使用 predict 更合适。
下面的链接有更加详细的解释,供读者参考:
https://www.statsmodels.org/dev/examples/notebooks/generated/statespace_forecasting.html
实际运用
因为我们需要对未来的时间点进行预测,所以选用 forecast 函数,但是如果直接调用 forecast_values = fit.forecast(steps=3) 实现预测未来3个时间点的值,会发现预测出的三个值是一样的,显然结果不对。
后来是参考了国外一个机器学习的教学网站:
https://machinelearningmastery.com/make-manual-predictions-arima-models-python/
了解到,为了提高预测的准确度,可以使用滚动预测。
滚动预测
滚动预测方法的使用方式如下:
测试数据集中的每个时间点都会迭代。在每次迭代中,都会根据所有可用的历史数据训练新的 ARIMA 模型。该模型用于预测第二天的情况。将存储预测,并从测试集中检索“真实”观察结果,并将其添加到历史记录中以供下次迭代使用。 简单来说,就是先通过训练集拟合出来的模型往后预测一天,然后将测试集中这天的真实值加入到训练集里面,再进行拟合预测,反复迭代。直到全部预测出训练集中的数据。向后预测的代码
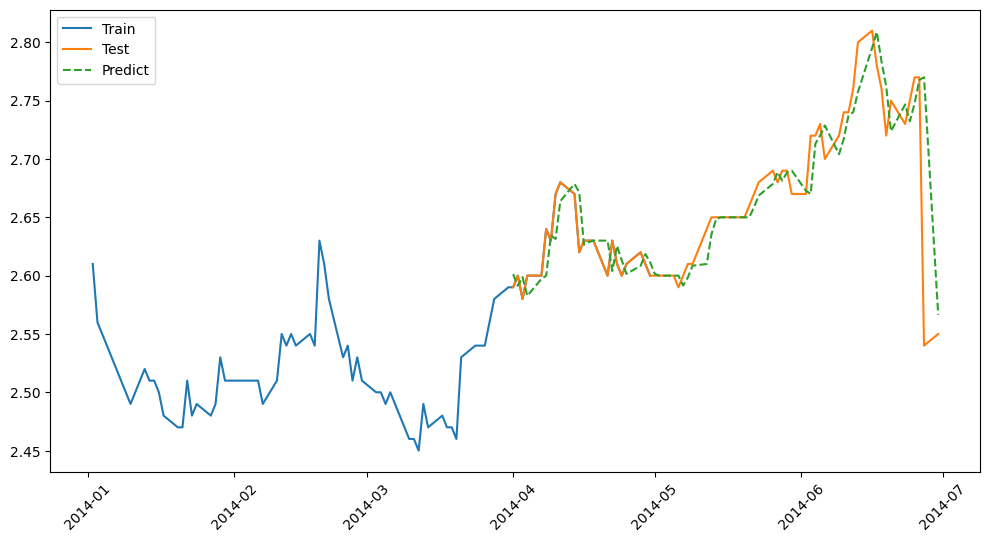
p = 1d = 1q = 0history = list(train.values)forecast = list()for t in range(len(test.values)):model = sm.tsa.ARIMA(history, order=(p,d,q))model_fit = model.fit()output = model_fit.forecast()yhat = output[0]forecast.append(yhat)obs = test[t]history.append(obs) # 这里实现了滚动预测,应该是ARIMA只能预测下一步而不能多步predict = pd.Series(forecast, index=test.index)# 绘制结果plt.figure(figsize=(12, 6))plt.plot(train.index, train, label='Train')plt.plot(test.index, test, label='Test')plt.plot(predict.index, predict, label='Predict', linestyle='--')# plt.plot(predict_sunspots, label='Fit')plt.legend()plt.xticks(rotation=45)plt.show()运行结果:

可以发现,预测的结果比之前好了很多。
二、Matlab 代码实现
在之前的博客中有存疑的地方,现已解决。ADF检验
首先是 ADF 检验部分,在 python 中 ADF 检验的结果为:
timeseries_adf : (np.float64(-2.902677813259885), np.float64(0.04503748919120268), 0, 61, {'1%': np.float64(-3.542412746661615), '5%': np.float64(-2.910236235808284), '10%': np.float64(-2.5927445767266866)}, np.float64(-227.51423828600673))可以看到,第一个数据只是小于了 '10%'后的数据,并没有很好的拒绝原假设,所以可以理解为该数据不平稳。
在 Matlab 中,检验的结果为:

同样没有拒绝原假设。
所以后来对代码进行改进时,我也在 python 代码里对数据进行了一阶差分,确保了数据的平稳性。
确定 p、q 的值
一开始使用 AIC 准则和 BIC 准则获取的结果如下:


显然是不太对劲的,怀疑是代码部分的问题。
之后我又研究了一下 Matlab 中 aicbic(logL, numParam, n) 函数。
aicbic(logL, numParam, n) 函数
在 ARIMA 模型中,numParams 代表模型的参数数量。具体来说,ARIMA 模型由三个主要部分组成:AR(AutoRegressive,自回归部分)、I(Integrated,差分部分)和 MA(Moving Average,移动平均部分)。模型的形式通常表示为 ARIMA(p, d, q),其中:
p 是自回归项的阶数。d 是差分次数。q 是移动平均项的阶数。 详细解释
定义 aicbic 函数:
示例数据和参数:
LogL 是对数似然值。p, d, q 是 ARIMA 模型的参数。include_constant 是一个布尔值,指示是否包括常数项。n 是样本数量。 计算参数数量:
使用公式numParams = p + q + (1 if include_constant else 0)。 计算 AIC 和 BIC 并打印结果:
使用aicbic 函数计算并打印 AIC 和 BIC 值。 所以使用网格搜索法确定 p、q 的值,调用aicbic(logL, numParam, n) 函数时,numParams = p + q
修改代码之后的结果:


BIC 准则的结果相对更加准确些,模型复杂性也较低,所以确定出 p = 1,q = 0。
向后预测的代码
在 Matlab 中我也同样使用了滚动预测的思想,代码如下:
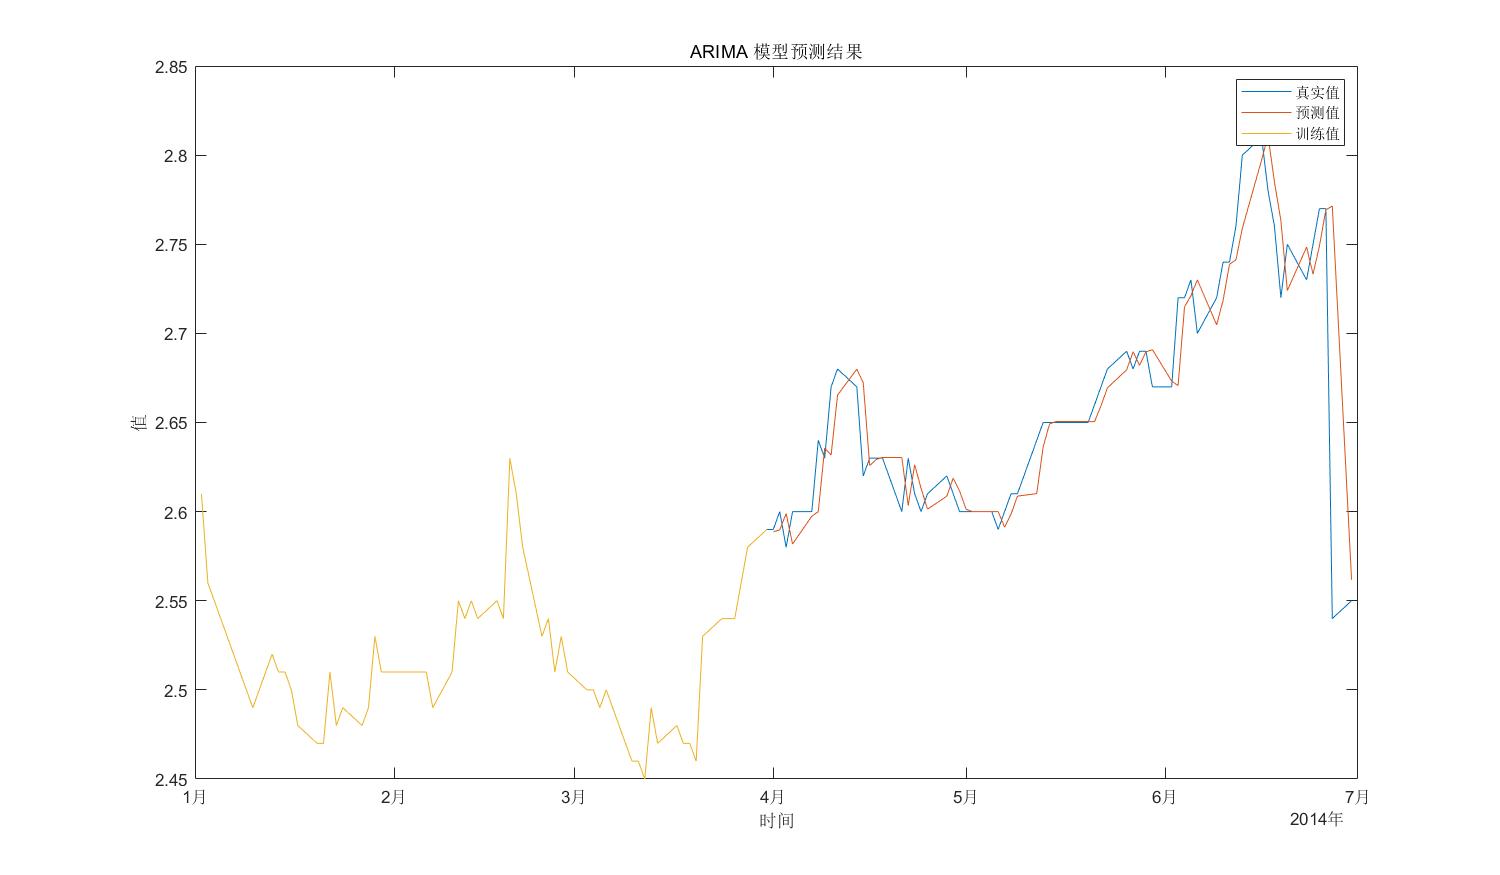
history = train;predict = zeros(length(test),1);for i = 1:length(test) % 简化模型为 ARIMA(1,1,0) model = arima(1,1,0); % 估计模型参数 md1 = estimate(model, history, 'Display', 'off'); % 进行预测 [Y, YMSE] = forecast(md1, 1, 'Y0', history); % 存储预测结果 predict(i) = Y; % 更新历史数据 history = [history; test(i)];endorigin_close = close_data(1:127);origin_date = date_data(1:127);% 绘制预测结果与真实值的比较figure('Position', [100, 100, 1200, 700]); plot(origin_date,origin_close, test_date, predict, train_date, train);legend('真实值','预测值','训练值');title('ARIMA 模型预测结果');xlabel('时间');ylabel('值');运行结果:

可以看出,预测结果还不错。
三、python 和 Matlab 的完整代码
python
# %%import pandas as pdimport matplotlib.pyplot as plt# 导入数据ChinaBank = pd.read_csv('ChinaBank.csv',index_col = 'Date',parse_dates=['Date'])ChinaBank.head()# %%# 提取Close列ChinaBank.index = pd.to_datetime(ChinaBank.index)sub = ChinaBank.loc['2014-01':'2014-06','Close']sub.head()# %%# 划分训练测试集train = sub.loc['2014-01':'2014-04']test = sub.loc['2014-04':'2014-06']#查看训练集的时间序列与数据(只包含训练集)plt.figure(figsize=(12,6))plt.plot(train)plt.xticks(rotation=45) #旋转45度plt.show()# %%from statsmodels.tsa.stattools import adfuller as ADFtimeseries_adf = ADF(train.tolist())# 打印单位根检验结果print('timeseries_adf : ', timeseries_adf)# %%# 一阶差分train_dif1 = train.diff(1).fillna(0)# %%# 打印单位根检验结果print('一阶差分 : ',ADF(train_dif1.tolist()))# %%train_dif1.plot(subplots=True,figsize=(12,6))plt.show()# %%# 参数确定import statsmodels.api as sm# 绘制fig = plt.figure(figsize=(12,7))ax1 = fig.add_subplot(211)fig = sm.graphics.tsa.plot_acf(train_dif1, lags=20,ax=ax1)ax1.xaxis.set_ticks_position('bottom') # 设置坐标轴上的数字显示的位置,top:显示在顶部 bottom:显示在底部#fig.tight_layout()ax2 = fig.add_subplot(212)fig = sm.graphics.tsa.plot_pacf(train_dif1, lags=20, ax=ax2)ax2.xaxis.set_ticks_position('bottom')#fig.tight_layout()plt.show()# %%train_results = sm.tsa.arma_order_select_ic(train, ic=['aic', 'bic'], trend='n', max_ar=6, max_ma=6)print('AIC', train_results.aic_min_order)print('BIC', train_results.bic_min_order)# %%# 模型检验#根据以上求得p = 1d = 1q = 0model = sm.tsa.ARIMA(train, order=(p,d,q))results = model.fit()resid = results.resid #获取残差#绘制#查看测试集的时间序列与数据(只包含测试集)fig, ax = plt.subplots(figsize=(12, 5))ax = sm.graphics.tsa.plot_acf(resid, lags=40, ax=ax)plt.show()# %%start_index = train.index[2]end_index = train.index[-1]predict_sunspots = results.predict(start_index, end=end_index)print(predict_sunspots)#查看训练集的时间序列与数据(只包含训练集)plt.figure(figsize=(12,6))plt.plot(train)plt.xticks(rotation=45) #旋转45度plt.plot(predict_sunspots)plt.show()# %%p = 1d = 1q = 0history = list(train.values)forecast = list()for t in range(len(test.values)):model = sm.tsa.ARIMA(history, order=(p,d,q))model_fit = model.fit()output = model_fit.forecast()yhat = output[0]forecast.append(yhat)obs = test[t]history.append(obs) # 这里实现了滚动预测,应该是ARIMA只能预测下一步而不能多步predict = pd.Series(forecast, index=test.index)# 绘制结果plt.figure(figsize=(12, 6))plt.plot(train.index, train, label='Train')plt.plot(test.index, test, label='Test')plt.plot(predict.index, predict, label='Predict', linestyle='--')# plt.plot(predict_sunspots, label='Fit')plt.legend()plt.xticks(rotation=45)plt.show()Matlab
clc;clear%% 数据读取% 读取 CSV 文件filename = 'ChinaBank.csv';data = readtable(filename);% 读取文件中的两列close_data = data.Close;date_data = data.Date;% 划分训练测试集train = close_data(1:62);test = close_data(63:127);train_date = date_data(1:62);test_date = date_data(63:127);% 定义候选模型阶数范围maxP = 8;maxQ = 8;n = length(train);% 初始化结果存储aicValues = NaN(maxP, maxQ);bicValues = NaN(maxP, maxQ);% 迭代计算所有候选模型的AIC和BIC值for p = 0:maxP for q = 0:maxQ try Mdl = arima(p,1,q); [~,~,logL] = estimate(Mdl, train, 'Display', 'off'); numParam = p + q; % p个AR参数, q个MA参数 [aicValues(p+1, q+1),bicValues(p+1, q+1)] = aicbic(logL, numParam, n); catch % 忽略无法估计的模型 continue; end endend% 找到AIC最小值对应的(p, q)[minAIC, idxAIC] = min(aicValues(:));[pAIC, qAIC] = ind2sub(size(aicValues), idxAIC);pAIC = pAIC - 1;qAIC = qAIC - 1;% 找到BIC最小值对应的(p, q)[minBIC, idxBIC] = min(bicValues(:));[pBIC, qBIC] = ind2sub(size(bicValues), idxBIC);pBIC = pBIC - 1;qBIC = qBIC - 1;fprintf('AIC选择的模型阶数: p = %d, q = %d\n', pAIC, qAIC);fprintf('BIC选择的模型阶数: p = %d, q = %d\n', pBIC, qBIC);model = arima(1,1,0);md1 = estimate(model, train, 'Display', 'off');% 检查残差的自相关性residuals = infer(md1, train);figure;autocorr(residuals);title('Residuals Autocorrelation');history = train;predict = zeros(length(test),1);for i = 1:length(test) % 简化模型为 ARIMA(1,1,0) model = arima(1,1,0); % 估计模型参数 md1 = estimate(model, history, 'Display', 'off'); % 进行预测 [Y, YMSE] = forecast(md1, 1, 'Y0', history); % 存储预测结果 predict(i) = Y; % 更新历史数据 history = [history; test(i)];endorigin_close = close_data(1:127);origin_date = date_data(1:127);% 绘制预测结果与真实值的比较figure('Position', [100, 100, 1200, 700]); plot(origin_date,origin_close, test_date, predict, train_date, train);legend('真实值','预测值','训练值');title('ARIMA 模型预测结果');xlabel('时间');ylabel('值');数据集下载链接:
链接: https://pan.baidu.com/s/1DVl9GbmN47-2riVr3r_KkA?pwd=tirr