目录
一、线性回归
<1>线性回归中的函数
<2>线性回归方程绘图
二、多项式回归
三、拟合度输出
四、线性预测
五、多元回归
一、线性回归
<1>线性回归中的函数
stats.mode()            #众数
numpy.median()          #中位数
numpy.mean()            #平均数
numpy.std()             #标准差
numpy.var()	      #方差
numpy.percentile(数组,数字)
x = numpy.random.uniform(0.0,5.0,250)
 #250 个介于 0 到 5 之间的随机浮点数的数组
 x = numpy.random.normal(5.0, 1.0, 100000)
 #正态随机数组 平均值为 5.0,标准差为 1.0
标准差 sigma σ
方差 sigma square σ^2
百分位数:
假设我们有一个数组,包含住在一条街上的人的年龄。
ages = [5,31,43,48,50,41,7,11,15,39,80,82,32,2,8,6,25,36,27,61,31]
什么是 75 百分位数?答案是 43,这意味着 75% 的人是 43 岁或以下
<2>线性回归方程绘图
import matplotlib.pyplot as plt
from scipy import stats

x = [5,7,8,7,2,17,2,9,4,11,12,9,6]
y = [99,86,87,88,111,86,103,87,94,78,77,85,86]

slope, intercept, r, p, std_err = stats.linregress(x, y)
#slope 是线性回归线的 斜率,  intercept 是 线性回归线的截距, r 是衡量拟合性能度量(越高拟合越好(0-1))

def myfunc(x):
  return slope * x + intercept

mymodel = list(map(myfunc, x))

plt.scatter(x, y)
plt.plot(x, mymodel)
plt.show()
运行结果
二、多项式回归
import numpy
import matplotlib.pyplot as plt

x = [1,2,3,5,6,7,8,9,10,12,13,14,15,16,18,19,21,22]
y = [100,90,80,60,60,55,60,65,70,70,75,76,78,79,90,99,99,100]

mymodel = numpy.poly1d(numpy.polyfit(x, y, 3))

myline = numpy.linspace(1, 22, 100)

plt.scatter(x, y)
plt.plot(myline, mymodel(myline))
plt.show()
运行结果

1、np.poly1d()此函数有两个参数:
参数1:为一个数组,若没有参数2,则生成一个多项式,例如:
p = np.poly1d([2,3,5,7])
print(p) ==>>2x3 + 3x2 + 5x + 7 数组中的数值为coefficient(系数),从后往前 0,1,2.。。为位置书的次数
参数2:若参数2为True,则表示把数组中的值作为根,然后反推多项式,例如:
q = np.poly1d([2,3,5],True)
print(q) ===>>(x - 2)*(x - 3)*(x - 5) = x3 - 10x2 + 31x -30
参数3:variable=‘z’表示改变未知数的字母,例如:
q = np.poly1d([2,3,5],True,varibale = 'z')
print(q) ===>>(z - 2)*(z - 3)*(z - 5) = z3 - 10z2 + 31z -30
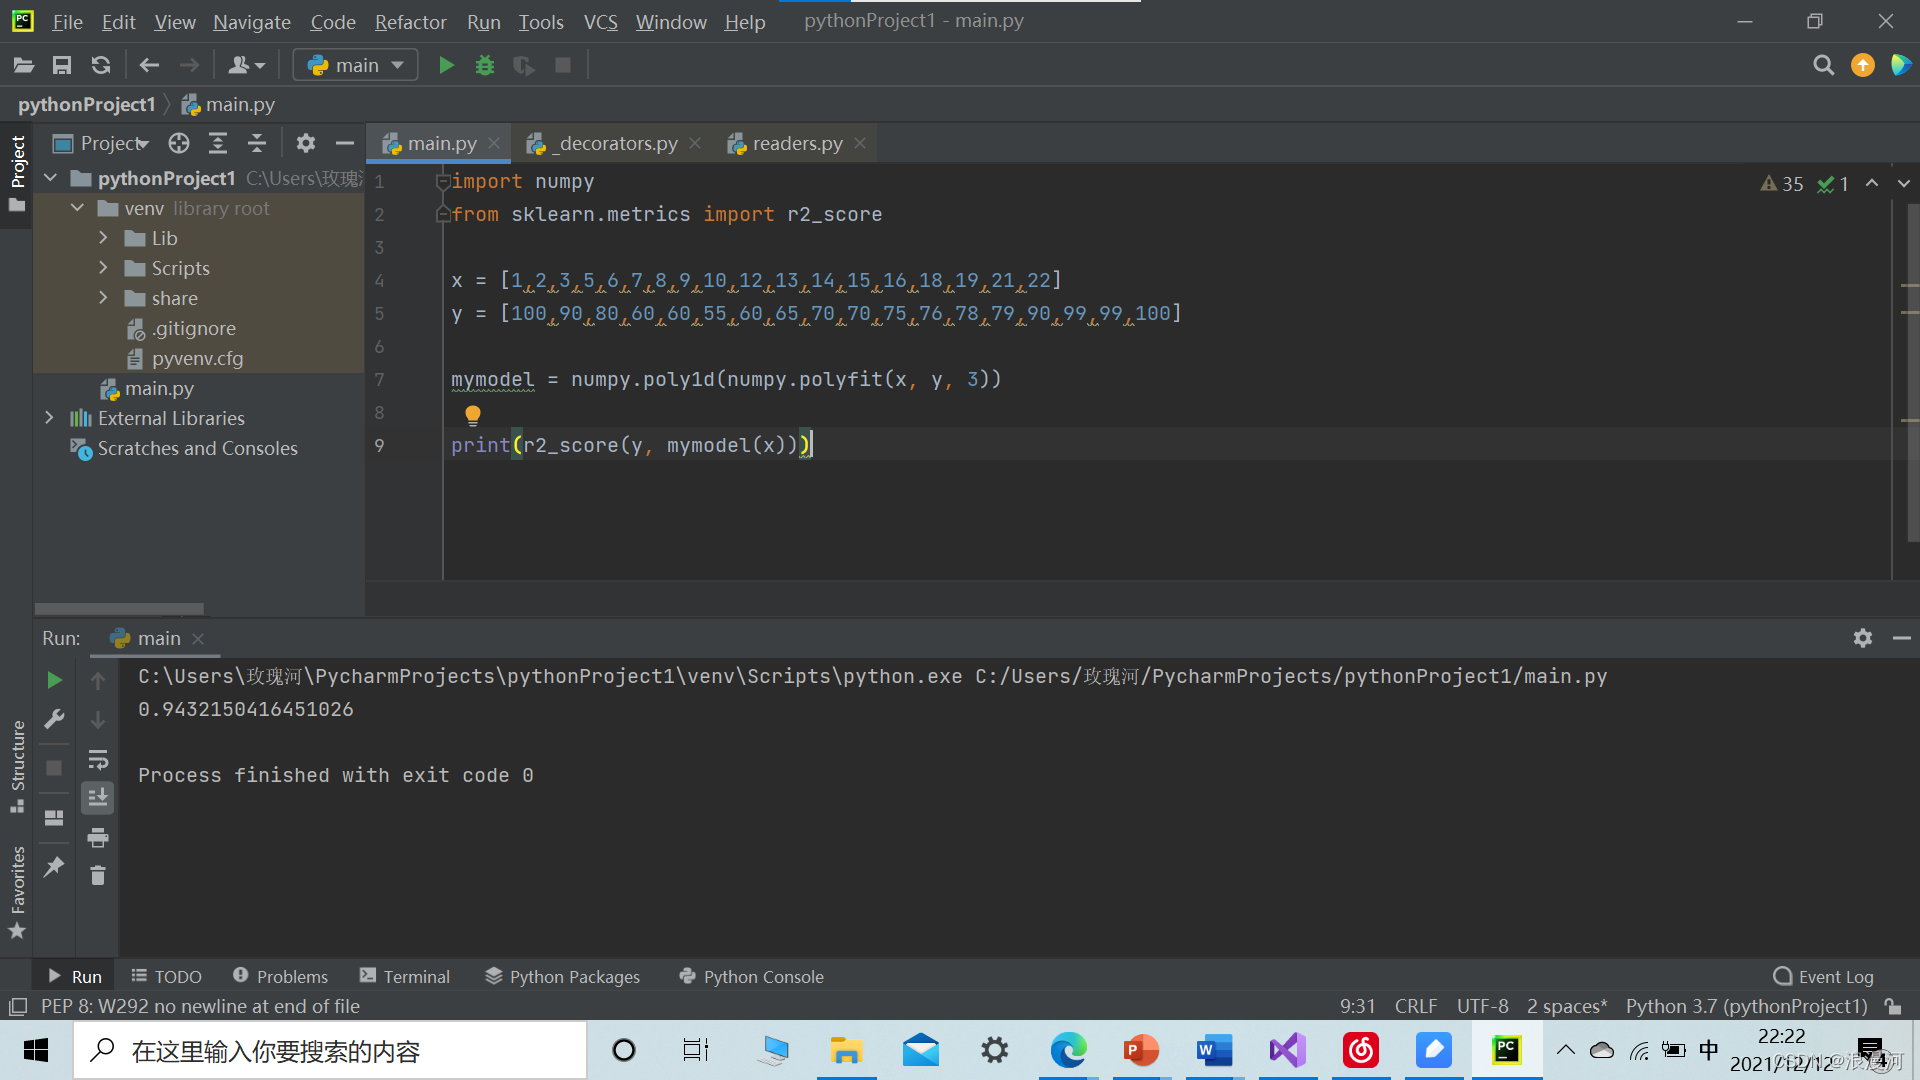
三、拟合度输出
import numpy
from sklearn.metrics import r2_score

x = [1,2,3,5,6,7,8,9,10,12,13,14,15,16,18,19,21,22]
y = [100,90,80,60,60,55,60,65,70,70,75,76,78,79,90,99,99,100]

mymodel = numpy.poly1d(numpy.polyfit(x, y, 3))

print(r2_score(y, mymodel(x)))
运行结果

r=0.9432150416451026 拟合度很好
四、线性预测
import numpy
from sklearn.metrics import r2_score

x = [1,2,3,5,6,7,8,9,10,12,13,14,15,16,18,19,21,22]
y = [100,90,80,60,60,55,60,65,70,70,75,76,78,79,90,99,99,100]

mymodel = numpy.poly1d(numpy.polyfit(x, y, 3))

speed = mymodel(17)
print(speed)
运行结果
可以得到当x=17时,y=88.87331269697978
五、多元回归
多元回归就像线性回归一样,但是具有多个独立值,这意味着我们试图基于两个或多个变量来预测一个值。
可以通过以下数据,经过分析得到线性回归方程从而预测结果。
| Car | Model | Volume | Weight | CO2 |
|---|---|---|---|---|
| Toyota | Aygo | 1000 | 790 | 99 |
| Mitsubishi | Space Star | 1200 | 1160 | 95 |
| Skoda | Citigo | 1000 | 929 | 95 |
| Fiat | 500 | 900 | 865 | 90 |
| Mini | Cooper | 1500 | 1140 | 105 |
| VW | Up! | 1000 | 929 | 105 |
| Skoda | Fabia | 1400 | 1109 | 90 |
| Mercedes | A-Class | 1500 | 1365 | 92 |
| Ford | Fiesta | 1500 | 1112 | 98 |
| Audi | A1 | 1600 | 1150 | 99 |
| Hyundai | I20 | 1100 | 980 | 99 |
| Suzuki | Swift | 1300 | 990 | 101 |
| Ford | Fiesta | 1000 | 1112 | 99 |
| Honda | Civic | 1600 | 1252 | 94 |
| Hundai | I30 | 1600 | 1326 | 97 |
| Opel | Astra | 1600 | 1330 | 97 |
| BMW | 1 | 1600 | 1365 | 99 |
| Mazda | 3 | 2200 | 1280 | 104 |
| Skoda | Rapid | 1600 | 1119 | 104 |
| Ford | Focus | 2000 | 1328 | 105 |
| Ford | Mondeo | 1600 | 1584 | 94 |
| Opel | Insignia | 2000 | 1428 | 99 |
| Mercedes | C-Class | 2100 | 1365 | 99 |
| Skoda | Octavia | 1600 | 1415 | 99 |
| Volvo | S60 | 2000 | 1415 | 99 |
| Mercedes | CLA | 1500 | 1465 | 102 |
| Audi | A4 | 2000 | 1490 | 104 |
| Audi | A6 | 2000 | 1725 | 114 |
| Volvo | V70 | 1600 | 1523 | 109 |
| BMW | 5 | 2000 | 1705 | 114 |
| Mercedes | E-Class | 2100 | 1605 | 115 |
| Volvo | XC70 | 2000 | 1746 | 117 |
| Ford | B-Max | 1600 | 1235 | 104 |
| BMW | 2 | 1600 | 1390 | 108 |
| Opel | Zafira | 1600 | 1405 | 109 |
| Mercedes | SLK | 2500 | 1395 | 120 |
import pandas
from sklearn import linear_model

df = pandas.read_csv("cars.csv")

X = df[['Weight', 'Volume']]
y = df['CO2']

regr = linear_model.LinearRegression()
regr.fit(X, y)

# 预测重量为 2300kg、排量为 1300ccm 的汽车的二氧化碳排放量:

predictedCO2 = regr.predict([[2300, 1300]])

print(predictedCO2)
Pandas 模块允许我们读取 文件并返回一个 DataFrame 对象。(可以用外部的excel表的数据)
使用LinearRegression()函数创建线性回归对象。
