目录
编辑
第一部分:插值的基本原理及应用
1. 插值的基本原理
1.1 插值多项式
1.2 拉格朗日插值
1.3 牛顿插值
1.4 样条插值
2. 插值的Python实现
2.1 使用 NumPy 进行插值
2.2 使用 SciPy 进行插值
2.2.1 一维插值
编辑
2.2.2 二维插值
3. 插值的应用场景
3.1 数据平滑和填补
3.2 图像处理
编辑
3.3 数值模拟
4. 实例分析
实例1:空气质量数据的校准
编辑
实例2:波浪能最大输出功率设计
第二部分:拟合的基本原理及应用
1. 拟合的基本原理
1.1 线性拟合
1.2 多项式拟合
1.3 指数拟合
编辑
1.4 对数拟合
编辑
1.5 幂函数拟合
2. 拟合的Python实现
2.1 使用 SciPy 进行拟合
2.1.1 线性拟合
2.1.2 多项式拟合
2.1.3 指数拟合
2.1.4 对数拟合
2.1.5 幂函数拟合
3. 拟合的应用场景
3.1 数据预测
3.2 数据建模
3.3 物理实验数据分析
3.4 工程设计
4. 实例分析
实例1:股票价格预测
实例2:温度变化分析
总结

专栏:数学建模学习笔记
第一部分:插值的基本原理及应用
1. 插值的基本原理
插值是一种在已知数据点之间估算函数值的方法。它在数据分析、信号处理和数值分析中具有广泛应用。插值的目标是通过构造一个插值函数,使该函数在给定的数据点处具有精确的函数值。
1.1 插值多项式

1.2 拉格朗日插值

import numpy as npimport matplotlib.pyplot as plt# 拉格朗日基函数def lagrange_basis(x, x_values, j): basis = 1 for i in range(len(x_values)): if i != j: basis *= (x - x_values[i]) / (x_values[j] - x_values[i]) return basis# 拉格朗日插值多项式def lagrange_interpolation(x, x_values, y_values): interpolation = 0 for j in range(len(y_values)): interpolation += y_values[j] * lagrange_basis(x, x_values, j) return interpolation# 数据点x_values = np.array([0, 1, 2, 3, 4, 5])y_values = np.array([1, 3, 2, 5, 7, 8])# 插值点x_interp = np.linspace(0, 5, 100)y_interp = [lagrange_interpolation(x, x_values, y_values) for x in x_interp]# 绘图plt.plot(x_values, y_values, 'o', label='Data points')plt.plot(x_interp, y_interp, '-', label='Lagrange Interpolation')plt.legend()plt.xlabel('x')plt.ylabel('y')plt.show() 
1.3 牛顿插值

import numpy as npimport matplotlib.pyplot as plt# 计算差分商def divided_diff(x_values, y_values): n = len(x_values) coef = np.zeros([n, n]) coef[:,0] = y_values for j in range(1,n): for i in range(n-j): coef[i][j] = (coef[i+1][j-1] - coef[i][j-1]) / (x_values[i+j] - x_values[i]) return coef[0,:]# 牛顿插值多项式def newton_interpolation(x, x_values, coef): n = len(x_values) - 1 p = coef[n] for k in range(1,n+1): p = coef[n-k] + (x -x_values[n-k])*p return p# 数据点x_values = np.array([0, 1, 2, 3, 4, 5])y_values = np.array([1, 3, 2, 5, 7, 8])# 计算差分商系数coef = divided_diff(x_values, y_values)# 插值点x_interp = np.linspace(0, 5, 100)y_interp = [newton_interpolation(x, x_values, coef) for x in x_interp]# 绘图plt.plot(x_values, y_values, 'o', label='Data points')plt.plot(x_interp, y_interp, '-', label='Newton Interpolation')plt.legend()plt.xlabel('x')plt.ylabel('y')plt.show() 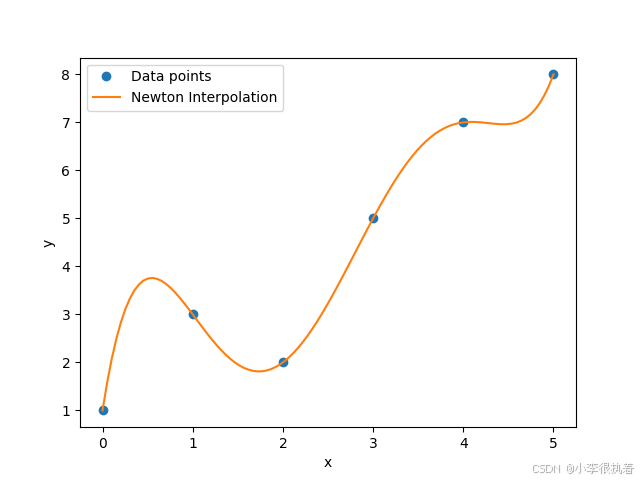
1.4 样条插值
样条插值是一种分段插值方法。常见的样条插值包括线性样条和三次样条。三次样条插值具有良好的光滑性和逼近性能,是一种常用的插值方法。
三次样条插值代码示例:
import numpy as npfrom scipy.interpolate import CubicSplineimport matplotlib.pyplot as plt# 数据点x = np.array([0, 1, 2, 3, 4, 5])y = np.array([1, 3, 2, 5, 7, 8])# 创建三次样条插值对象cs = CubicSpline(x, y)# 插值点x_interp = np.linspace(0, 5, 100)y_interp = cs(x_interp)# 绘图plt.plot(x, y, 'o', label='Data points')plt.plot(x_interp, y_interp, '-', label='Cubic Spline Interpolation')plt.legend()plt.xlabel('x')plt.ylabel('y')plt.show()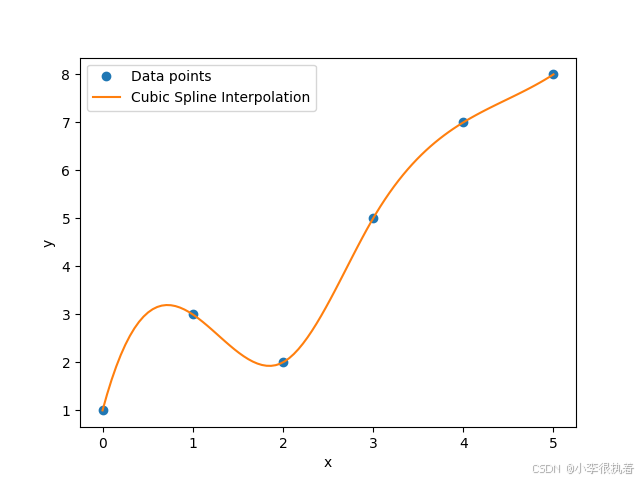
2. 插值的Python实现
Python 提供了丰富的库来实现插值方法,主要包括 NumPy 和 SciPy 库。
2.1 使用 NumPy 进行插值
NumPy 提供了一些基本的插值函数,例如 numpy.interp 可以进行一维线性插值。
import numpy as npimport matplotlib.pyplot as plt# 原始数据点x = np.linspace(0, 10, 10)y = np.sin(x)# 插值点x_interp = np.linspace(0, 10, 100)y_interp = np.interp(x_interp, x, y)# 绘图plt.plot(x, y, 'o', label='Original data')plt.plot(x_interp, y_interp, '-', label='Interpolated data')plt.xlabel('X')plt.ylabel('Y')plt.legend()plt.show()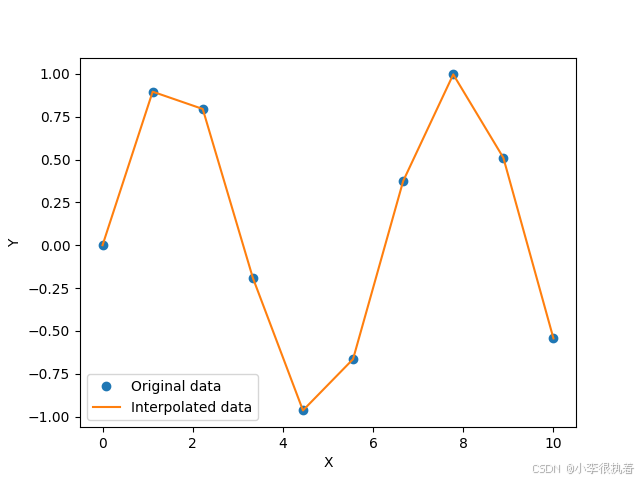
2.2 使用 SciPy 进行插值
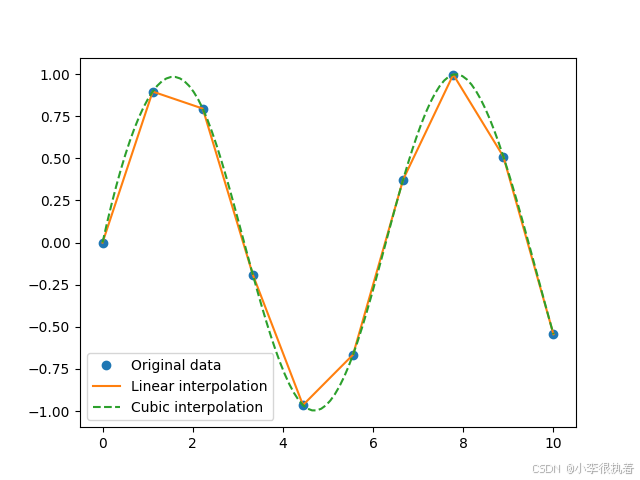
SciPy 提供了更加全面的插值函数,例如 scipy.interpolate.interp1d 和 scipy.interpolate.CubicSpline。
2.2.1 一维插值
from scipy.interpolate import interp1dimport numpy as npimport matplotlib.pyplot as plt# 原始数据点x = np.linspace(0, 10, 10)y = np.sin(x)# 创建插值对象linear_interp = interp1d(x, y, kind='linear')cubic_interp = interp1d(x, y, kind='cubic')# 插值点x_interp = np.linspace(0, 10, 100)y_linear = linear_interp(x_interp)y_cubic = cubic_interp(x_interp)# 绘图plt.plot(x, y, 'o', label='Original data')plt.plot(x_interp, y_linear, '-', label='Linear interpolation')plt.plot(x_interp, y_cubic, '--', label='Cubic interpolation')plt.legend()plt.show()2.2.2 二维插值
from scipy.interpolate import RectBivariateSplineimport numpy as npimport matplotlib.pyplot as plt# 原始数据点x = np.linspace(0, 10, 10)y = np.linspace(0, 10, 10)z = np.sin(x[:, None] + y[None, :])# 创建插值对象linear_interp = RectBivariateSpline(x, y, z, kx=1, ky=1)cubic_interp = RectBivariateSpline(x, y, z, kx=3, ky=3)# 插值点x_interp = np.linspace(0, 10, 100)y_interp = np.linspace(0, 10, 100)z_linear = linear_interp(x_interp, y_interp)z_cubic = cubic_interp(x_interp, y_interp)# 绘图plt.subplot(1, 2, 1)plt.imshow(z_linear, extent=(0, 10, 0, 10), origin='lower', aspect='auto')plt.title('Linear interpolation')plt.subplot(1, 2, 2)plt.imshow(z_cubic, extent=(0, 10, 0, 10), origin='lower', aspect='auto')plt.title('Cubic interpolation')plt.show() 
3. 插值的应用场景
插值在许多实际问题中都有广泛的应用,例如:
3.1 数据平滑和填补
在处理实验数据时,可能会遇到一些缺失值或噪声数据。插值可以用于平滑数据和填补缺失值,使数据更加连贯。
import numpy as npfrom scipy.interpolate import interp1dimport matplotlib.pyplot as plt# 原始数据点,包含缺失值x = np.array([0, 1, 2, 4, 5, 7, 8, 9])y = np.array([3, 2, 7, 1, 8, 6, 2, 5])# 创建插值对象f_linear = interp1d(x, y, kind='linear')# 插值点,包括原始数据点和缺失值x_interp = np.arange(0, 10, 1)y_interp = f_linear(x_interp)# 绘图plt.plot(x, y, 'o', label='Original data')plt.plot(x_interp, y_interp, '-', label='Interpolated data')plt.xlabel('X')plt.ylabel('Y')plt.legend()plt.show()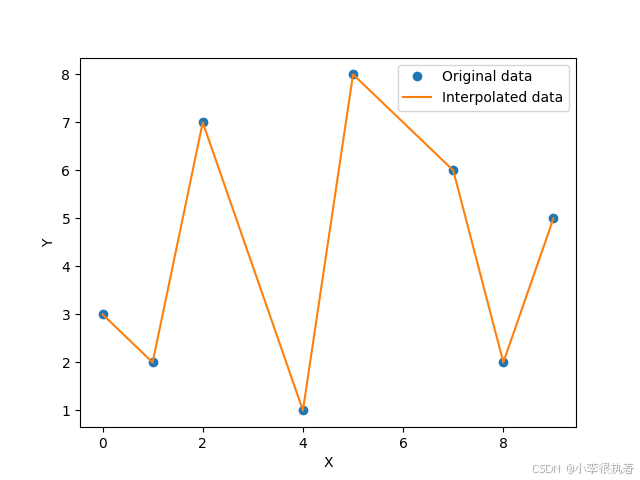
3.2 图像处理
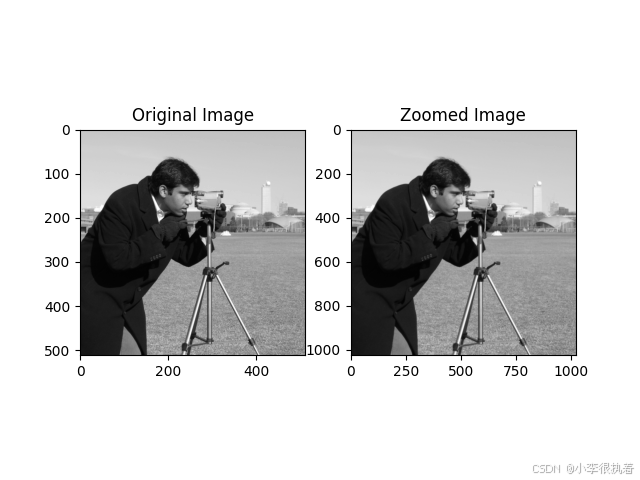
在图像处理领域,插值常用于图像的放大、缩小和旋转。例如,双线性插值和双三次插值是常用的图像插值方法。
import numpy as npfrom scipy.ndimage import zoomimport matplotlib.pyplot as pltfrom skimage import data# 加载示例图像image = data.camera()# 使用双线性插值进行图像缩放zoom_factor = 2image_zoomed = zoom(image, zoom_factor, order=1) # order=1 表示双线性插值# 显示原始图像和缩放后的图像plt.subplot(1, 2, 1)plt.title('Original Image')plt.imshow(image, cmap='gray')plt.subplot(1, 2, 2)plt.title('Zoomed Image')plt.imshow(image_zoomed, cmap='gray')plt.show()3.3 数值模拟
在数值模拟中,插值用于构造离散点之间的连续函数。例如,在有限元方法中,插值用于构造形函数。
import numpy as npfrom scipy.interpolate import CubicSplineimport matplotlib.pyplot as plt# 离散点x = np.linspace(0, 10, 10)y = np.sin(x)# 创建三次样条插值对象cs = CubicSpline(x, y)# 插值点x_interp = np.linspace(0, 10, 100)y_interp = cs(x_interp)# 绘图plt.plot(x, y, 'o', label='Discrete points')plt.plot(x_interp, y_interp, '-', label='Cubic Spline Interpolation')plt.xlabel('X')plt.ylabel('Y')plt.legend()plt.show()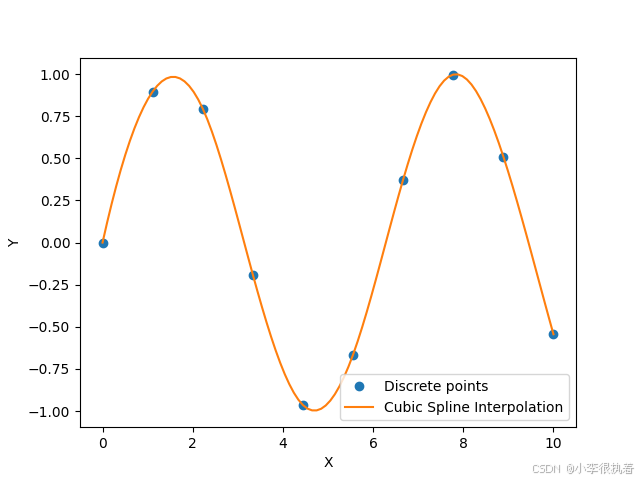
4. 实例分析
为了更好地理解插值方法,我们来看一个具体的实例分析。
实例1:空气质量数据的校准
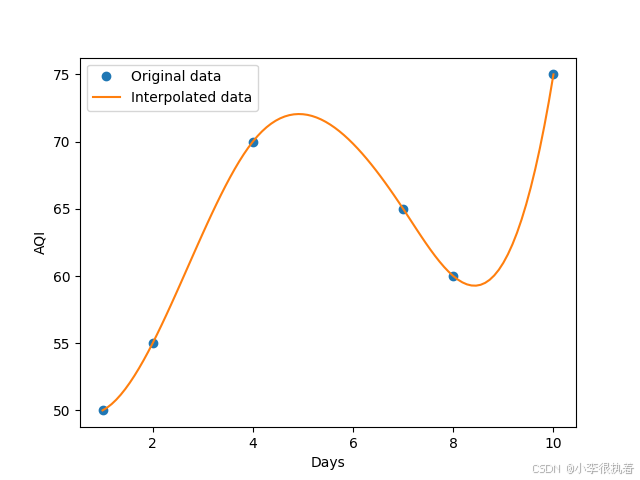
在2019年的全国大学生数学建模竞赛中,赛题涉及到空气质量数据的校准问题,需要使用插值算法来处理不完整的数据。
import numpy as npfrom scipy.interpolate import interp1dimport matplotlib.pyplot as plt# 原始数据点days = np.array([1, 2, 4, 7, 8, 10])aqi = np.array([50, 55, 70, 65, 60, 75])# 创建插值对象interp = interp1d(days, aqi, kind='cubic')# 插值点days_interp = np.linspace(1, 10, 100)aqi_interp = interp(days_interp)# 绘图plt.plot(days, aqi, 'o', label='Original data')plt.plot(days_interp, aqi_interp, '-', label='Interpolated data')plt.xlabel('Days')plt.ylabel('AQI')plt.legend()plt.show()实例2:波浪能最大输出功率设计
在2022年的全国大学生数学建模竞赛中,赛题涉及到波浪能最大输出功率的设计问题,需要使用插值算法来优化设计参数。
import numpy as npfrom scipy.interpolate import interp1dimport matplotlib.pyplot as plt# 原始数据点wave_heights = np.array([0.5, 1.0, 1.5, 2.0, 2.5, 3.0])power_output = np.array([10, 20, 30, 40, 50, 60])# 创建插值对象interp = interp1d(wave_heights, power_output, kind='cubic')# 插值点wave_heights_interp = np.linspace(0.5, 3.0, 100)power_output_interp = interp(wave_heights_interp)# 绘图plt.plot(wave_heights, power_output, 'o', label='Original data')plt.plot(wave_heights_interp, power_output_interp, '-', label='Interpolated data')plt.xlabel('Wave Heights (m)')plt.ylabel('Power Output (kW)')plt.legend()plt.show()、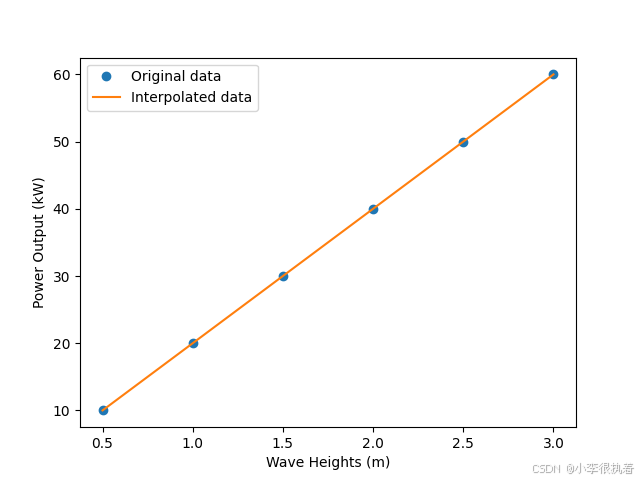
第二部分:拟合的基本原理及应用
1. 拟合的基本原理
拟合是一种通过选择适当的函数形式,使该函数尽可能逼近已知数据点的方法。拟合的目的是通过已有的数据点,预测或估计未知数据点的值。拟合方法包括线性拟合、多项式拟合、指数拟合、对数拟合等。
1.1 线性拟合
线性拟合假设数据点之间的关系是线性的,通过最小二乘法求解线性方程组,得到拟合直线。线性拟合的目标函数为:

from scipy.optimize import curve_fitimport numpy as npimport matplotlib.pyplot as plt# 线性拟合函数def linear_func(x, a, b): return a * x + b# 数据点xdata = np.linspace(0, 10, 10)ydata = 2.5 * xdata + 1.0 + np.random.normal(size=len(xdata))# 拟合popt, pcov = curve_fit(linear_func, xdata, ydata)yfit = linear_func(xdata, *popt)# 绘图plt.plot(xdata, ydata, 'o', label='Data')plt.plot(xdata, yfit, '-', label='Linear Fit')plt.xlabel('X')plt.ylabel('Y')plt.legend()plt.show()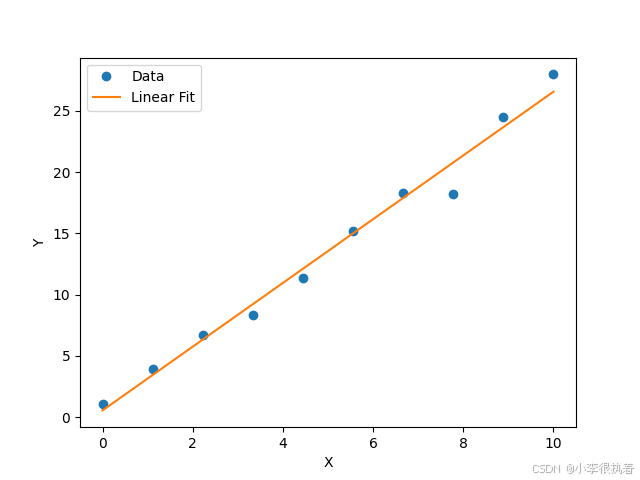
1.2 多项式拟合
多项式拟合使用多项式函数来拟合数据点。多项式的阶数越高,拟合效果越好,但也容易出现过拟合现象。多项式拟合的目标函数为:
![]()
import numpy as npimport matplotlib.pyplot as plt# 数据点xdata = np.linspace(0, 10, 10)ydata = 2.5 * xdata**2 + 1.0 + np.random.normal(size=len(xdata))# 多项式拟合p = np.polyfit(xdata, ydata, 2)yfit = np.polyval(p, xdata)# 绘图plt.plot(xdata, ydata, 'o', label='Data')plt.plot(xdata, yfit, '-', label='Polynomial Fit')plt.xlabel('X')plt.ylabel('Y')plt.legend()plt.show() 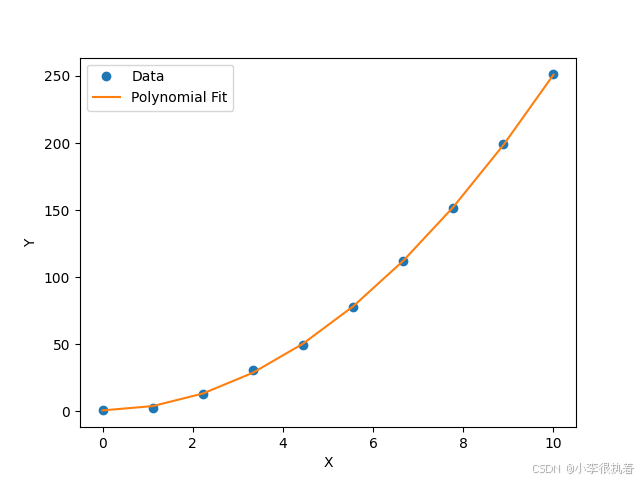
1.3 指数拟合
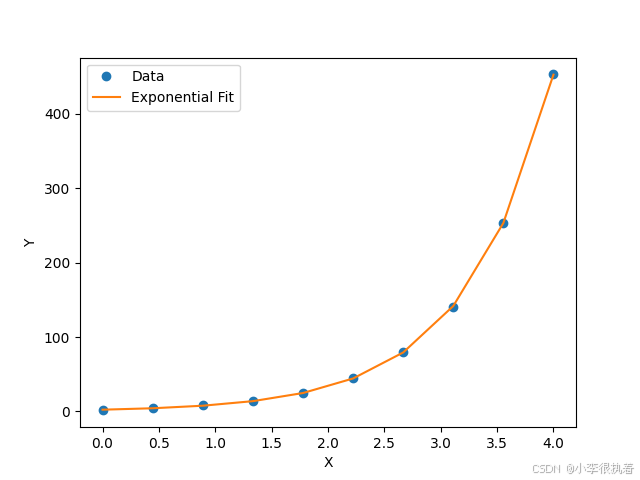
指数拟合假设数据点之间的关系是指数函数,通过对数变换和线性拟合相结合的方法进行求解。指数拟合的目标函数为:
![]()
from scipy.optimize import curve_fitimport numpy as npimport matplotlib.pyplot as plt# 指数拟合函数def exponential_func(x, a, b): return a * np.exp(b * x)# 数据点xdata = np.linspace(0, 4, 10)ydata = 2.5 * np.exp(1.3 * xdata) + np.random.normal(size=len(xdata))# 拟合popt, pcov = curve_fit(exponential_func, xdata, ydata)yfit = exponential_func(xdata, *popt)# 绘图plt.plot(xdata, ydata, 'o', label='Data')plt.plot(xdata, yfit, '-', label='Exponential Fit')plt.xlabel('X')plt.ylabel('Y')plt.legend()plt.show()1.4 对数拟合
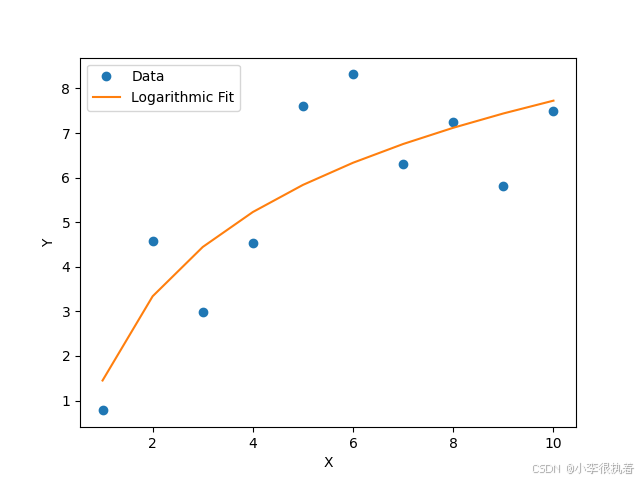
对数拟合假设数据点之间的关系是对数函数,通过非线性最小二乘法进行求解。对数拟合的目标函数为:
![]()
from scipy.optimize import curve_fitimport numpy as npimport matplotlib.pyplot as plt# 对数拟合函数def logarithmic_func(x, a, b): return a * np.log(x) + b# 数据点xdata = np.linspace(1, 10, 10)ydata = 2.5 * np.log(xdata) + 1.0 + np.random.normal(size=len(xdata))# 拟合popt, pcov = curve_fit(logarithmic_func, xdata, ydata)yfit = logarithmic_func(xdata, *popt)# 绘图plt.plot(xdata, ydata, 'o', label='Data')plt.plot(xdata, yfit, '-', label='Logarithmic Fit')plt.xlabel('X')plt.ylabel('Y')plt.legend()plt.show()1.5 幂函数拟合
幂函数拟合假设数据点之间的关系是幂函数,通过对数变换和线性拟合相结合的方法进行求解。幂函数拟合的目标函数为:

from scipy.optimize import curve_fitimport numpy as npimport matplotlib.pyplot as plt# 幂函数拟合函数def power_func(x, a, b): return a * x**b# 数据点xdata = np.linspace(1, 10, 10)ydata = 2.5 * xdata**1.5 + np.random.normal(size=len(xdata))# 拟合popt, pcov = curve_fit(power_func, xdata, ydata)yfit = power_func(xdata, *popt)# 绘图plt.plot(xdata, ydata, 'o', label='Data')plt.plot(xdata, yfit, '-', label='Power Fit')plt.xlabel('X')plt.ylabel('Y')plt.legend()plt.show()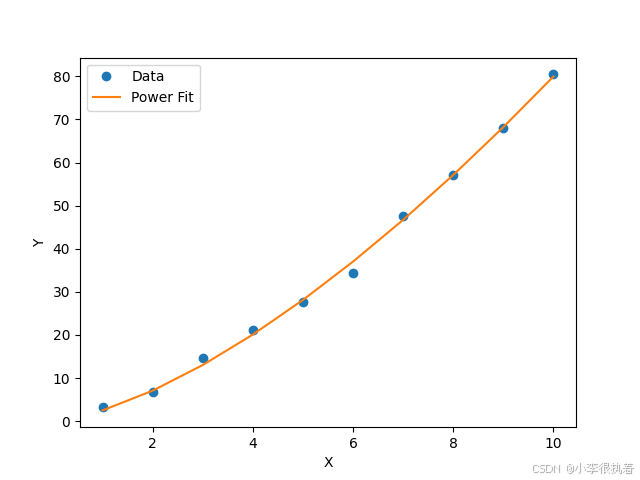
2. 拟合的Python实现
Python 提供了丰富的库来处理拟合问题,常用的库包括 SciPy 和 NumPy。
2.1 使用 SciPy 进行拟合
SciPy 提供了多种拟合函数,例如 scipy.optimize.curve_fit 可以进行非线性拟合。
2.1.1 线性拟合
from scipy.optimize import curve_fitimport numpy as npimport matplotlib.pyplot as plt# 线性拟合函数def linear_func(x, a, b): return a * x + b# 数据点xdata = np.linspace(0, 10, 50)ydata = 2.5 * xdata + 1.0 + 0.5 * np.random.normal(size=len(xdata))# 拟合popt, pcov = curve_fit(linear_func, xdata, ydata)yfit = linear_func(xdata, *popt)# 绘图plt.plot(xdata, ydata, 'b-', label='Data')plt.plot(xdata, yfit, 'r-', label='Fit: a=%.3f, b=%.3f' % tuple(popt))plt.legend()plt.show()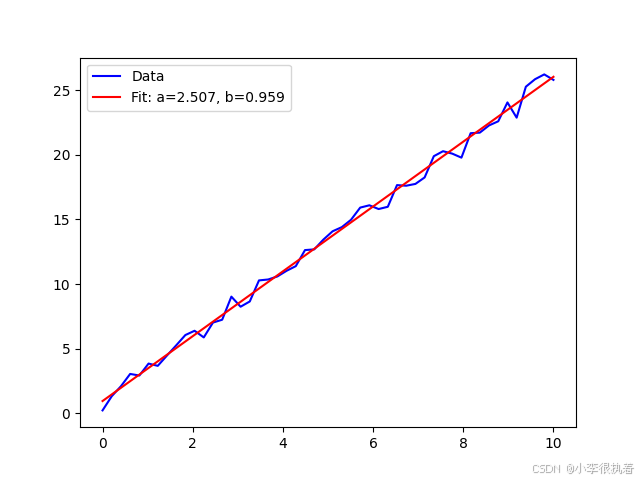
2.1.2 多项式拟合
import numpy as npimport matplotlib.pyplot as plt# 数据点xdata = np.linspace(0, 10, 50)ydata = 2.5 * xdata**2 + 1.0 + 0.5 * np.random.normal(size=len(xdata))# 拟合p = np.polyfit(xdata, ydata, 2)yfit = np.polyval(p, xdata)# 绘图plt.plot(xdata, ydata, 'b-', label='Data')plt.plot(xdata, yfit, 'r-', label='Polynomial fit')plt.legend()plt.show()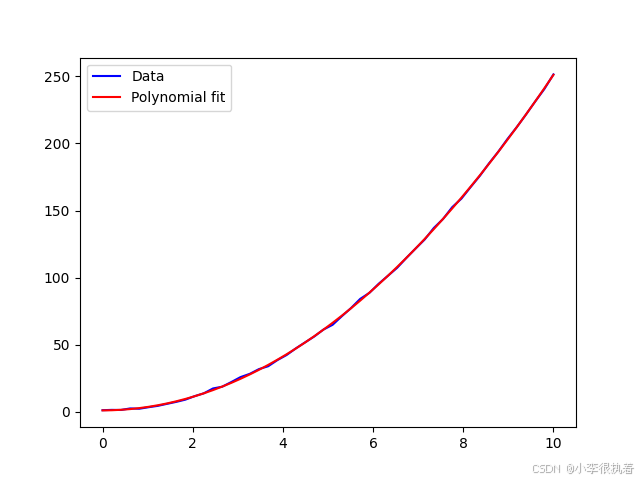
2.1.3 指数拟合
from scipy.optimize import curve_fitimport numpy as npimport matplotlib.pyplot as plt# 指数拟合函数def exponential_func(x, a, b): return a * np.exp(b * x)# 数据点xdata = np.linspace(0, 4, 50)ydata = 2.5 * np.exp(1.3 * xdata) + 0.5 * np.random.normal(size=len(xdata))# 拟合popt, pcov = curve_fit(exponential_func, xdata, ydata)yfit = exponential_func(xdata, *popt)# 绘图plt.plot(xdata, ydata, 'b-', label='Data')plt.plot(xdata, yfit, 'r-', label='Fit: a=%.3f, b=%.3f' % tuple(popt))plt.legend()plt.show()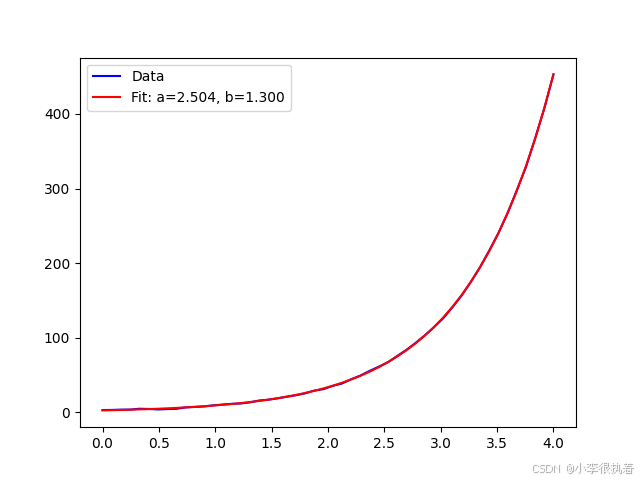
2.1.4 对数拟合
from scipy.optimize import curve_fitimport numpy as npimport matplotlib.pyplot as plt# 对数拟合函数def logarithmic_func(x, a, b): return a * np.log(x) + b# 数据点xdata = np.linspace(1, 10, 50)ydata = 2.5 * np.log(xdata) + 1.0 + 0.5 * np.random.normal(size=len(xdata))# 拟合popt, pcov = curve_fit(logarithmic_func, xdata, ydata)yfit = logarithmic_func(xdata, *popt)# 绘图plt.plot(xdata, ydata, 'b-', label='Data')plt.plot(xdata, yfit, 'r-', label='Fit: a=%.3f, b=%.3f' % tuple(popt))plt.legend()plt.show()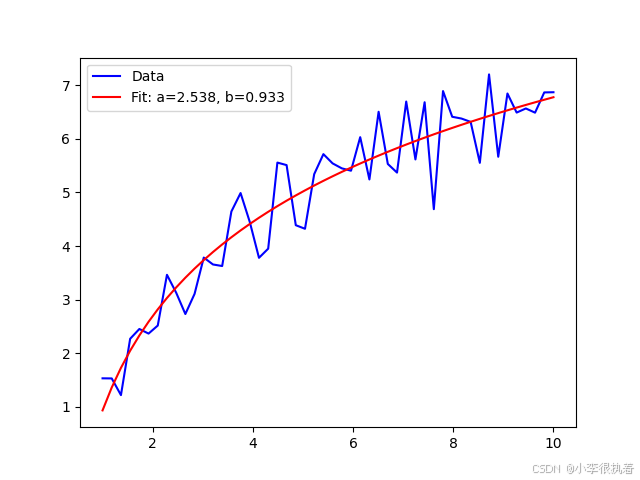
2.1.5 幂函数拟合
from scipy.optimize import curve_fitimport numpy as npimport matplotlib.pyplot as plt# 幂函数拟合函数def power_func(x, a, b): return a * x**b# 数据点xdata = np.linspace(1, 10, 50)ydata = 2.5 * xdata**1.5 + 0.5 * np.random.normal(size=len(xdata))# 拟合popt, pcov = curve_fit(power_func, xdata, ydata)yfit = power_func(xdata, *popt)# 绘图plt.plot(xdata, ydata, 'b-', label='Data')plt.plot(xdata, yfit, 'r-', label='Fit: a=%.3f, b=%.3f' % tuple(popt))plt.legend()plt.show()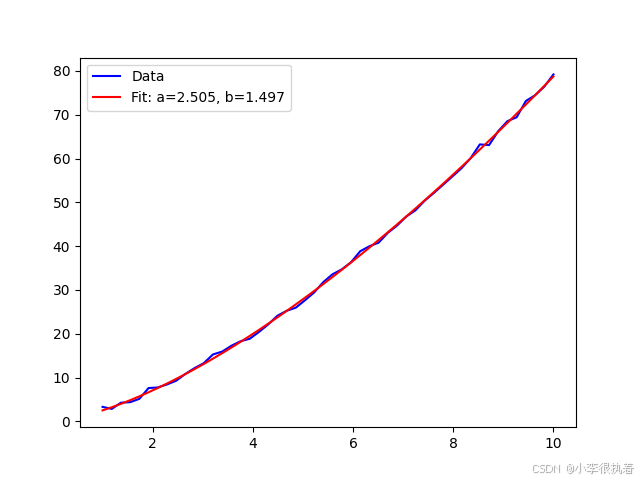
3. 拟合的应用场景
拟合在许多实际问题中都有广泛的应用,例如:
3.1 数据预测
在时间序列分析中,拟合常用于预测未来的数据点。例如,线性回归模型可以用于预测股票价格、温度变化等。
from scipy.optimize import curve_fitimport numpy as npimport matplotlib.pyplot as plt# 线性拟合函数def linear_func(x, a, b): return a * x + b# 数据点xdata = np.linspace(0, 10, 10)ydata = 2.5 * xdata + 1.0 + np.random.normal(size=len(xdata))# 拟合popt, pcov = curve_fit(linear_func, xdata, ydata)yfit = linear_func(xdata, *popt)# 预测未来的数据点x_predict = np.linspace(10, 15, 5)y_predict = linear_func(x_predict, *popt)# 绘图plt.plot(xdata, ydata, 'o', label='Data')plt.plot(xdata, yfit, '-', label='Linear Fit')plt.plot(x_predict, y_predict, 'x', label='Prediction')plt.xlabel('X')plt.ylabel('Y')plt.legend()plt.show()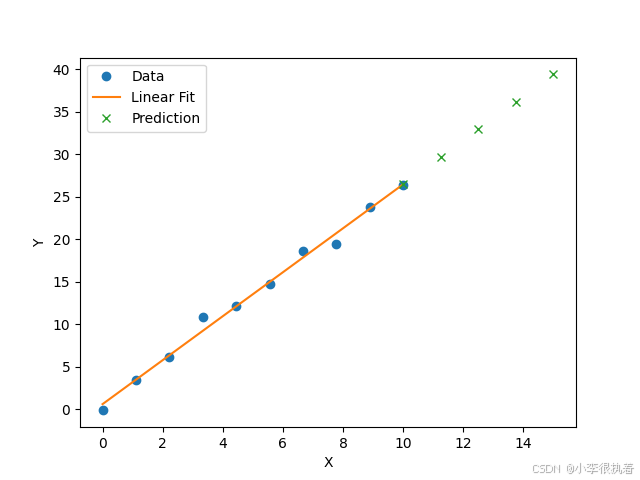
3.2 数据建模
在机器学习中,拟合用于构建回归模型,以揭示数据之间的关系。常见的回归模型包括线性回归、逻辑回归和多项式回归。
import numpy as npimport matplotlib.pyplot as plt# 数据点xdata = np.linspace(0, 10, 10)ydata = 2.5 * xdata**2 + 1.0 + np.random.normal(size=len(xdata))# 多项式拟合p = np.polyfit(xdata, ydata, 2)yfit = np.polyval(p, xdata)# 绘图plt.plot(xdata, ydata, 'o', label='Data')plt.plot(xdata, yfit, '-', label='Polynomial Fit')plt.xlabel('X')plt.ylabel('Y')plt.legend()plt.show()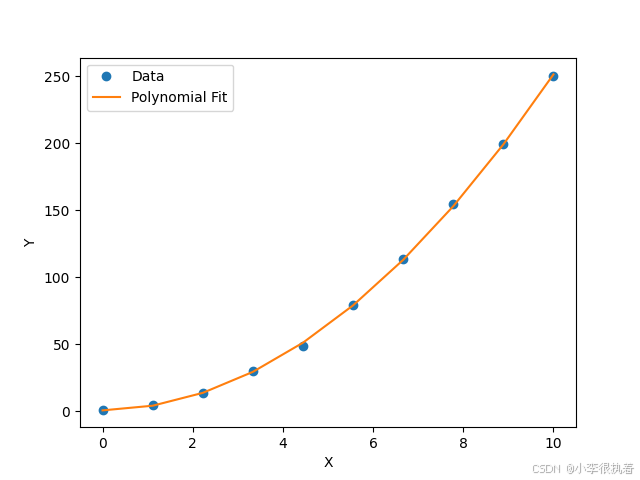
3.3 物理实验数据分析
在物理实验中,拟合用于分析实验数据,提取物理参数。例如,通过拟合实验数据,可以确定材料的弹性模量、热导率等物理参数。
from scipy.optimize import curve_fitimport numpy as npimport matplotlib.pyplot as plt# 指数拟合函数def exponential_func(x, a, b): return a * np.exp(b * x)# 实验数据点xdata = np.linspace(0, 4, 10)ydata = 2.5 * np.exp(1.3 * xdata) + np.random.normal(size=len(xdata))# 拟合popt, pcov = curve_fit(exponential_func, xdata, ydata)yfit = exponential_func(xdata, *popt)# 绘图plt.plot(xdata, ydata, 'o', label='Data')plt.plot(xdata, yfit, '-', label='Exponential Fit')plt.xlabel('X')plt.ylabel('Y')plt.legend()plt.show()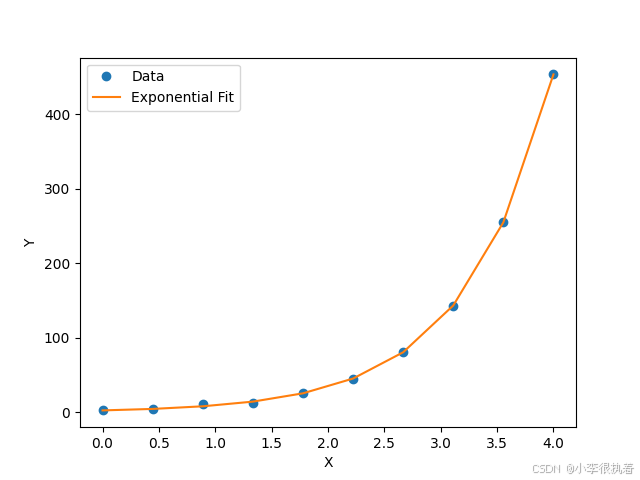
3.4 工程设计
在工程设计中,拟合用于优化设计参数。例如,在机械设计中,通过拟合实验数据,可以优化零件的尺寸和材料选择。
from scipy.optimize import curve_fitimport numpy as npimport matplotlib.pyplot as plt# 幂函数拟合函数def power_func(x, a, b): return a * x**b# 实验数据点xdata = np.linspace(1, 10, 10)ydata = 2.5 * xdata**1.5 + np.random.normal(size=len(xdata))# 拟合popt, pcov = curve_fit(power_func, xdata, ydata)yfit = power_func(xdata, *popt)# 绘图plt.plot(xdata, ydata, 'o', label='Data')plt.plot(xdata, yfit, '-', label='Power Fit')plt.xlabel('X')plt.ylabel('Y')plt.legend()plt.show()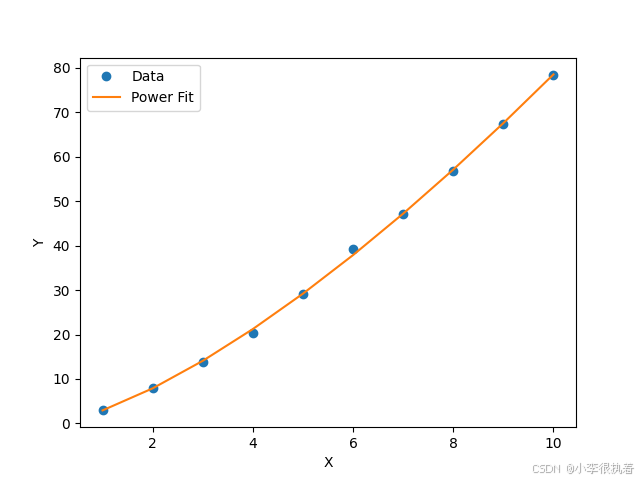
4. 实例分析
为了更好地理解拟合方法,我们来看几个具体的实例分析。
实例1:股票价格预测
通过拟合历史股票价格数据,可以预测未来的股票价格。
from scipy.optimize import curve_fitimport numpy as npimport matplotlib.pyplot as plt# 线性拟合函数def linear_func(x, a, b): return a * x + b# 历史股票价格数据days = np.array([1, 2, 3, 4, 5, 6, 7, 8, 9, 10])prices = np.array([10, 11, 13, 14, 15, 18, 19, 21, 22, 24])# 拟合popt, pcov = curve_fit(linear_func, days, prices)predicted_prices = linear_func(days, *popt)# 绘图plt.plot(days, prices, 'o', label='Historical data')plt.plot(days, predicted_prices, '-', label='Predicted data')plt.xlabel('Days')plt.ylabel('Prices')plt.legend()plt.show()
实例2:温度变化分析
通过拟合温度数据,可以分析温度变化的趋势。
from scipy.optimize import curve_fitimport numpy as npimport matplotlib.pyplot as plt# 指数拟合函数def exponential_func(x, a, b): return a * np.exp(b * x)# 温度数据days = np.array([1, 2, 3, 4, 5, 6, 7, 8, 9, 10])temperatures = np.array([15, 17, 20, 22, 24, 28, 30, 32, 35, 37])# 拟合popt, pcov = curve_fit(exponential_func, days, temperatures)predicted_temperatures = exponential_func(days, *popt)# 绘图plt.plot(days, temperatures, 'o', label='Historical data')plt.plot(days, predicted_temperatures, '-', label='Predicted data')plt.xlabel('Days')plt.ylabel('Temperatures')plt.legend()plt.show()
总结
插值与拟合的基本原理、常用方法及其Python实现,涵盖了拉格朗日插值、牛顿插值、样条插值等插值方法,以及线性拟合、多项式拟合、指数拟合、对数拟合和幂函数拟合等拟合方法,并通过具体的代码实例展示了插值与拟合在数据平滑、图像处理、数值模拟、数据预测、数据建模、物理实验数据分析和工程设计中的实际应用。

