图表可视化配色学习——自动提取图片主色调与配色方案(python、pillow、haishoku和seaborn),并生成十六进制颜色编码_意疏的学习笔记
| 图源1、图源2
无论绘制什么图表,配色方案都是非常重要的,配的好,整幅图看起来会自然美观,反之就可能很别扭。所谓的配色,笔者觉得就是一幅图表的几种主要颜色,一般绘图的工具都会提供一些调色板,供我们配色。但是工具提供的颜色色终究是比较有限的,有时我们可能需要自己配色。如果没有美术基础,自己配起来会比较难,这时我们可能需要借鉴其他的好看的图表的配色。用取色器一个一个的取色显得有些繁琐,不过最近笔者发现了一个小工具haishoku,它借助pillow获取色彩列表,可自动获取一幅图的主色调和配色方案,最多可以提取8种配色。haishoku只有300多行代码,体量很小,也是一个学习CV的小案例。以下将用haishoku提取配色方案,并用seaborn绘图,一起来看看吧。
copyright © 意疏:https://blog.csdn.net/sinat_35907936/article/details/120589389
Haishoku简介
-
haishoku源码简介
haishoku代码的核心是用pillow来获取一幅图像的颜色列表,使用Image模块的getcolors方法,该方法返回某RGB出现的频次和RGB值组成的元组,如下所示。注:maxcolors默认为256,即默认的最大颜色数只有256,如果输入图像中的颜色数大于256,需要修改默认值,否则getcolors返回会为空值。
from PIL import Image

img = Image.open('palette.png').convert('RGB')

# 缩小图片,以减少计算量和限制最大色彩数
img = img.resize((256, 256),Image.ANTIALIAS)
colors = img.getcolors(maxcolors=256*256)
colors_sorted_freq = sorted(colors, key=lambda x:x[0], reverse=True)
print(colors_sorted_freq)
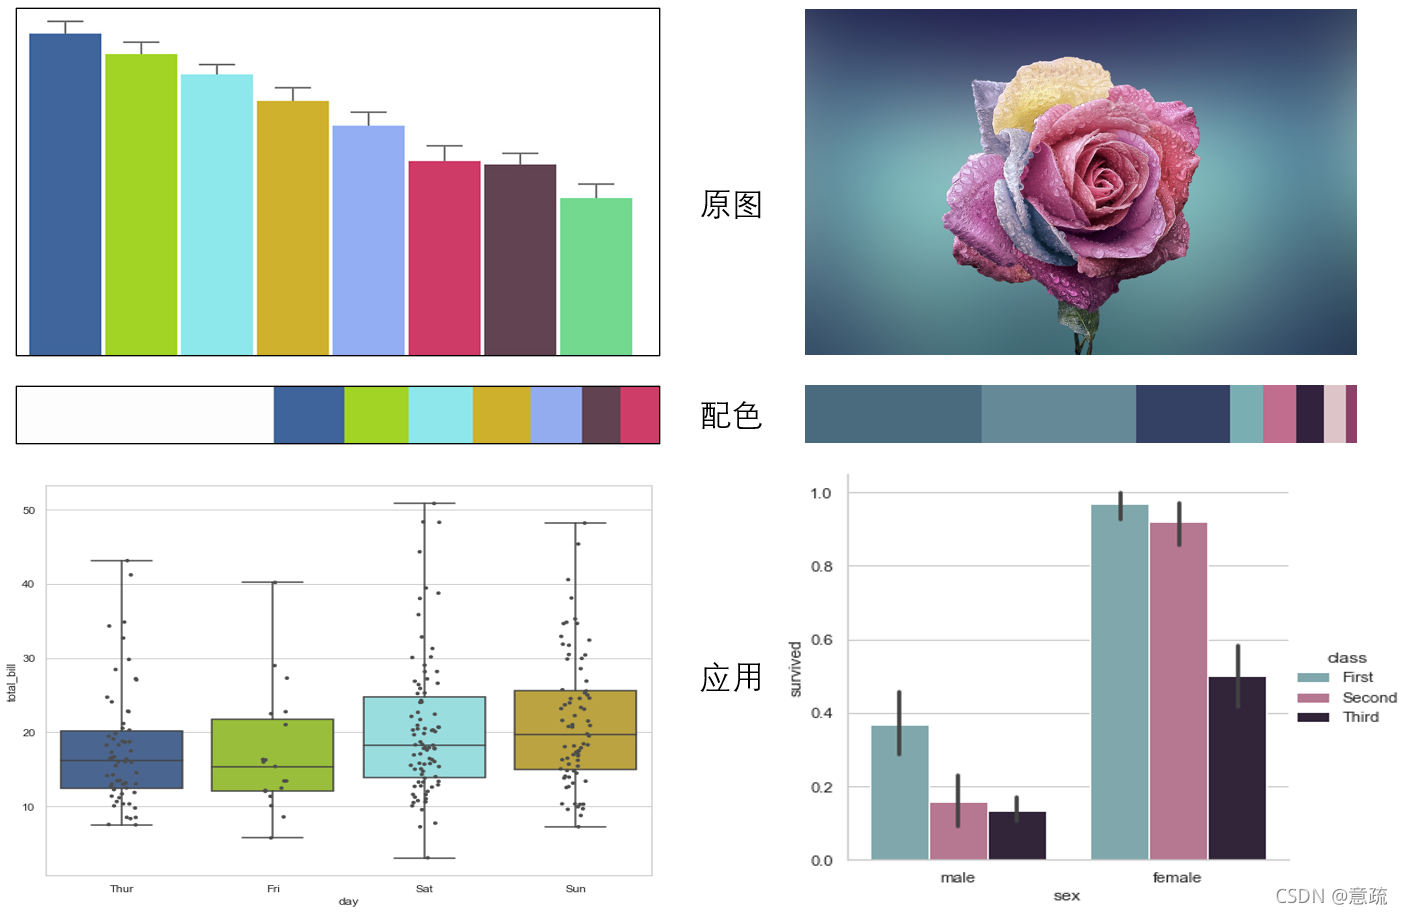
颜色列表:下图左与下图右的颜色列表
[(21025, (255, 255, 255)),
 (5544, (64, 101, 156)),
 (4992, (162, 212, 37)),
 (4626, (141, 232, 235)),
 (4394, (207, 177, 45)),
 (4077, (147, 174, 243)),
 (3196, (206, 59, 103)),
 (3083, (98, 67, 82)),
 (2624, (115, 217, 143)),
 (365, (208, 178, 48)),
 ...,
 ]

[(101, (43, 46, 89)),
 (100, (42, 45, 88)),
 (91, (46, 49, 92)),
 (89, (41, 44, 87)),
 (85, (44, 47, 90)),
 (83, (66, 97, 117)),
 (83, (45, 48, 91)),
 (80, (81, 124, 133)),
 (79, (39, 42, 87)),
 (77, (82, 125, 134)),
  ...,
 ]
主色调与配色:注意到,上面的颜色列表是按照颜色出现频次降序排列的。如果把第一个作为主色调,然后把前若干个作为配色方案,这对于下图左图来说是一个比较不错的方法。因为它颜色分明,而且各颜色集中,截取的前若干个颜色恰好是图像的配色方案的子集。但对于下图右图来讲,就不理想了,因为它虽然颜色分明,但是颜色不集中,RGB值是渐变的,分散的,同样是取前若干个颜色,得到的却只是主色调的子集,而不是图像中我们肉眼可见的几种主要颜色。
代码:包括生成RGB列表、十六进制RGB编码和显示色带。生成编码的目的是方便在绘图工具中直接使用。
from PIL import Image

img = Image.open('palette.png').convert('RGB')
# 缩小图片,以减少计算量和限制最大色彩数
img = img.resize((256, 256),Image.ANTIALIAS)
colors = img.getcolors(maxcolors=256*256)
colors_sorted_freq = sorted(colors, key=lambda x:x[0], reverse=True)

# 提取颜色数
color_num = 9

# 获取主要色彩RGB列表
main_RGB_list = [list(color[1]) for color in colors_sorted_freq[:color_num]]
print(main_RGB_list)

# 获取主要色彩16进制编码列表,hex函数输出字符前两个是0x
main_hex_list = ['#' + hex(color[1][0])[2:4] + hex(color[1][1])[2:4] + hex(color[1][2])[2:4] for color in colors_sorted_freq[:color_num]]
print(main_hex_list)

# 创建空图用于存放配色带
box_w, box_h = 1000,100
palette = Image.new('RGB', (box_w, box_h))

# 用于下面计算每种颜色占比
color_count_sum = sum([color[0] for color in colors_sorted_freq[:color_num]])

# 生成色带图
init_ul = 0
for color in colors_sorted_freq[:color_num]:
    img_w = math.ceil(box_w*color[0]/color_count_sum)
    new_image = Image.new('RGB', (img_w, box_h), color[1])
    palette.paste(new_image, (init_ul, 0))
    init_ul += img_w

palette.show()
RGB列表与十六进制RGB编码
[[255, 255, 255], [64, 101, 156], [162, 212, 37], [141, 232, 235], [207, 177, 45], [147, 174, 243], [206, 59, 103], [98, 67, 82], [115, 217, 143]]
['#ffffff', '#40659c', '#a2d425', '#8de8eb', '#cfb12d', '#93aef3', '#ce3b67', '#624352', '#73d98f']
现实中大多数图片中的RGB值都是渐变的,分散的,先把类似的颜色分组,再选主色调和配色方案才是合理的,这样保证了选出来的颜色是图像中的主要颜色。haishoku作者采用RGB值分别分为三组的形式,将一幅图片的RGB值拆分成了九个大组,再用每个大组里的RGB值的加权平均表示该组的颜色,其中权值是该RGB值在该组中出现的频次的占比,最后输出前8种颜色作为配色方案,详见源码。其实除了这种手动分组的形式,还可以通过聚类算法来自动分组,用聚类中心的RGB值作为该组的颜色代表。
copyright © 意疏:https://blog.csdn.net/sinat_35907936/article/details/120589389
-
安装与接口
安装:
pip install haishoku
接口:
showPalette   # 显示配色方案
showDominant  # 显示主色调
getDominant   # 获取主色调
getPalette    # 获取配色方案
Haishoku基本使用
Haishoku只为我们提供了最多8种颜色的配色方案,如果想要更多这需要修改其源码,这并不复杂。实际上,我们在绘图的时候,用到的颜色是不会太多的,所以8种应该也够。通过上述接口,我们可以很容易的获得配色方案并显示配色方案。
源码:
from haishoku.haishoku import Haishoku

path = 'palette.png'
# 可以用网页链接
# path = "http://wx2.sinaimg.cn/large/89243dfbly1ffoekfainzj20dw05k0u7.jpg"

# Haishoku是一个对象
h = Haishoku.loadHaishoku(path)
print(h.palette)
print(h.dominant)

palette = Haishoku.getPalette(path)
dominant = Haishoku.getDominant(path)

# 显示色带
Haishoku.showPalette(path)
# Haishoku.showDominant(path)
主色调与配色:输出了上图左图的主色调和配色,可以观察到主色调并不是(255,255,255),这也就间接说明了主色调与配色方案中的每一种颜色都是是求平均而来的。由于haishoku接口输出的依旧是元组,我们需要处理一下才方便使用,至于如何处理,请往下看。
[(0.4, (252, 253, 252)), (0.11, (63, 100, 155)), (0.1, (162, 212, 38)), (0.1, (142, 232, 235)), (0.09, (206, 176, 44)), (0.08, (146, 172, 239)), (0.06, (97, 66, 81)), (0.06, (206, 61, 104))]
(252, 253, 252)
配色方案应用——seaborn绘图
-
第一幅图配色应用
第一幅图配色方案的应用,由于已经用RGB_encode函数把Haishoku输出转换成了十六进制编码,所以直接把编码中的若干个传递给绘图函数就可以了,关键词palette,意思就是配色。

import seaborn as sns
import matplotlib.pyplot as plt
from haishoku.haishoku import Haishoku

def RGB_encode(color_list):

    # 获取主要色彩RGB列表
    main_RGB_list = [list(color[1]) for color in color_list]

    # 获取主要色彩16进制编码列表
    main_hex_list = ['#' + hex(color[1][0])[2:4] + hex(color[1][1])[2:4] + hex(color[1][2])[2:4] for color in color_list]
    return main_RGB_list, main_hex_list

# 获取配色方案
path = 'palette.png'
palette = Haishoku.getPalette(path)
main_RGB_list, main_hex_list = RGB_encode(palette)

print(main_RGB_list)
print(main_hex_list)

# 绘图
sns.set_style("whitegrid")
tips = sns.load_dataset("tips")

plt.figure(figsize=(10, 8))
ax = sns.boxplot(x="day", y="total_bill",
                 data=tips,whis=[0, 100], palette=main_hex_list[1:])
sns.stripplot(x="day", y="total_bill", data=tips,
              size=4, color=".3", linewidth=0)

plt.show()
如果出现以下错误,表明本地没有seaborn的内置数据,在github上面下载下来,然后放在C:\Users\YourName\seaborn-data目录下面即可。
URLError: <urlopen error [Errno 11004] getaddrinfo failed>
-
第二幅图配色应用
第二幅图也是类似的操作,代码修改很小。
import seaborn as sns
import matplotlib.pyplot as plt
from haishoku.haishoku import Haishoku

def RGB_encode(color_list):

    # 获取主要色彩RGB列表
    main_RGB_list = [list(color[1]) for color in color_list]

    # 获取主要色彩16进制编码列表
    main_hex_list = ['#' + hex(color[1][0])[2:4] + hex(color[1][1])[2:4] + hex(color[1][2])[2:4] for color in color_list]
    return main_RGB_list, main_hex_list

# 获取配色方案
path = 'rose.jpg'
palette = Haishoku.getPalette(path)
main_RGB_list, main_hex_list = RGB_encode(palette)

print(main_RGB_list)
print(main_hex_list)


# 绘图
sns.set_style("whitegrid")
titanic = sns.load_dataset("titanic")

plt.figure(figsize=(10, 8))

ax = sns.catplot(x="sex", y="survived", hue="class", kind="bar", data=titanic,palette=main_hex_list[3:])
plt.show()
注意到Haishoku这种手动分组的组数,即最大配色方案颜色数是不易更改的,牵一发而动全身。所以用聚类来进行颜色分组或许能取得更具有弹性的配色方案。后面笔者将尝试用聚类方法来获取一副图中的配色方案,欢迎关注。
copyright © 意疏:https://blog.csdn.net/sinat_35907936/article/details/120589389
参考
https://github.com/buptlihang/haishoku/blob/master/docs/document_zh.md
https://github.com/buptlihang/haishoku/blob/master/demo/demo.py
http://seaborn.pydata.org/examples/horizontal_boxplot.html


登录后可发表评论
点击登录